
GLSKA member Peter Attfield writes …
Last week (mid-June) I was kayak camping in Georgian Bay for a few days, and the water level was higher than I had ever seen. Some people I encountered claimed that the water was up a foot from last year, and one said ten feet from last year! I didn’t believe those claims, but I wondered how much was it actually up? How many years has it been rising? And how long ago was that low period I remember?
It was easy to find current and historical water level data online. I typed some into an Excel spreadsheet and got the spreadsheet to generate a graph so I could visualize the information. I used only July averages. Using a single month would eliminate the “noise” of the regular rise and fall through the seasons. I chose July because on average it is the month of peak water level – about 30 cm higher than the lowest months of January-February. And July is in the heart of our paddling season.
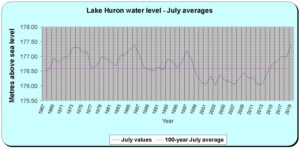
The graph ends in July 2019. Water level in June 2020 is actually about 10 cm higher than June 2019, and it is forecast that July will be similar to June. Every month so far in 2020 has been a record breaker in more than a century of regular measurements which began in 1918.